The working class is supposed to be the revolutionary agent of history, mobilizing for progressive change, yet according to studies like What’s the Matter with Kansas, the white working class (WWC) now votes Republican against its own economic interests. However, not everyone agrees with that assessment. Let’s take a look at some data.
A recent study, Beyond God and Guns, conducted right before the 2012 election, reveals some interesting information. The study defines the “white working class” as “non-Hispanic white Americans without a four-year college degree who hold non-salaried jobs”; they comprise 36% of the citizenry. Note that class status is not determined by how much money you earn, although not surprisingly only 42% earn more than $50,000 (compared to 76% of “college-educated whites,” defined in the study as those with a four-year degree; they comprise 21% of the citizenry).
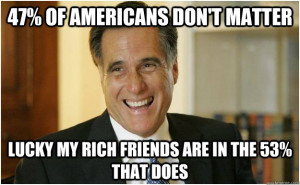
 Many people believe the WWC has switched from Democrat to Republican in the last few decades. The reality is more complicated. While the study did find that the WWC preferred Romney to Obama by 48%-35%, whereas college educated whites (CEW) where more evenly divided at 44%-42%, some subgroups are more anti-Obama than others. The WWC in the South strongly preferred Romney (62%), but there were no significant differences in other regions. WWC men preferred Romney (55%-28%), but women were split. WWC Protestants preferred Romney (56%-27%) but Catholics were split.
All that said, overall the majority of the WWC didn’t like either candidate. However, 61% said they liked Clinton, and 51% liked George W. Bush.
Interestingly, those in the WWC earning more than $30,000 favored Romney 51%-35%, while those earning less than $30,000 a year showed weaker support (42%-39%). Those who had been on Food Stamps in the last two years preferred Obama by 48% to 36%, whereas 50% of those not on Food Stamps preferred Romney.
Party identification among the WWC did not differ significantly from CEW, with 38% Independent, 30% Democrat, and 28% Republican, and no significant difference existed in terms of affiliation with the Tea Party (13% v. 10%), sharing the values of the Tea Party (34% v. 31%), or sharing the values of Unions (31% v. 29%). However, the WWC is much less likely to identify as “liberal” (19% v. 28%) or share the values of Occupy Wall Street (16% v. 28%).
On a side note, in 2011 27% of Americans said the shared the values of Occupy Wall Street, but by the time of the study, that number had dropped to 21% overall.
The WWC looks more progressive, when it comes to economic issues. When asked about the causes of America’s economic problems, the WWC has the same generally progressive views as the American people in general:
- 74% blame corporations moving jobs overseas.
- 72% blame risk taking by Wall Street.
- 65% blame Bush’s policies.
- 59% blame Obama’s policies.
- Yet, 65% blame government regulation of business.
In addition, consider these signs of left populism:
- 66% of Americans believe that the economic system unfairly favors the wealthy (70% WWC, 62% CEW)
- 54% believe not everyone has an equal chance (53% WWC, 48% CEW)
- 62% favor the “Buffett Rule” that would increase taxes on income over $1 million (62% WWC, 66% CEW)
- 44% believe capitalism is at odds with Christian values (46% WWC, 35% CEW)
- 53% think the American Dream still holds (47% WWC, 63% CEW)
At the same time:
- 58% of Americans want lower taxes and less services (61% WWC, 60% CEW)
- 70% think the poor are too dependent on government services (75% WWC, 68% CEW)
- While 54% think America’s best days are ahead (46% WWC, 57% CEW), 52% of the WWC in the South thinks are best days are behind us.
In terms of patriotism, the WWC is more likely than CEW to believe that God has given the US a special role in history (70%-42%), more likely to think America used to be a Christian nation but no longer is (46%-30%), and more likely to display an American flag (63%-58%).
While WWC and CEW citizens are equally likely to live in a household with a gun (51%-47%), the WWC is more favorable towards the NRA (66%-46%) and not surprisingly, gun ownership among the WWC is highest in the South (62%).
In addition, while they are no more or less religious, the WWC is more likely than CEW to be evangelical Protestant (36%-21%). And they are much more likely to be authoritarian or highly authoritarian, as measured by how they view childrearing (65%-41%) — which disturbingly puts them in accord with most Americans who hold authoritarian attitudes (62%).
Finally, the WWC differs in its views of race. They are more likely than CEW to believe we pay too much attention to the problems of blacks and other minorities (49%-32%, including 58% of WWC in the South), more likely to think discrimination against whites is a big problem (60%-39%, including 69% in the South), more likely to think immigrants are taking jobs from American citizens (57%-37%), and less likely to support the DREAM Act (51%-67%). Notably, “white evangelical Protestants are the only religious group in which a majority does not support the basic tenets of the DREAM Act.”
On social issues, 50% of the WWC wants abortion to be legal in all or most cases, and 43% support marriage equality (with 50% opposed).
When asked what their most important issue is, however, only 3% said abortion and only 2% said same-sex marriage. 53% said the economy.
